9 COVID-19 Data Dashboards I’ve Been Watching
Watching and reading the horrific news of the increasing number of coronavirus cases and deaths feels like an ongoing punch in the gut. The daily onslaught of bad news is overwhelming for all of us, but it’s nothing compared to those who have loved ones that have been impacted directly by this illness.
As I struggle to consider what this crisis will mean for my family and those closest to us, I’ve found that I’m far more grounded if I’m looking at how the trends have evolved over time (not just the latest headline). Even though we are still in the thick of it, more data brings more perspective, and that’s something that has meant a lot for me personally.
I realized recently that I may not be alone in this, and that some of the marketers that read our blog regularly may also find these resources helpful. So I compiled a short list of my favorite sources for up-to-date data and trends that I’ve been following during this crisis. I hope they are helpful for you, too.
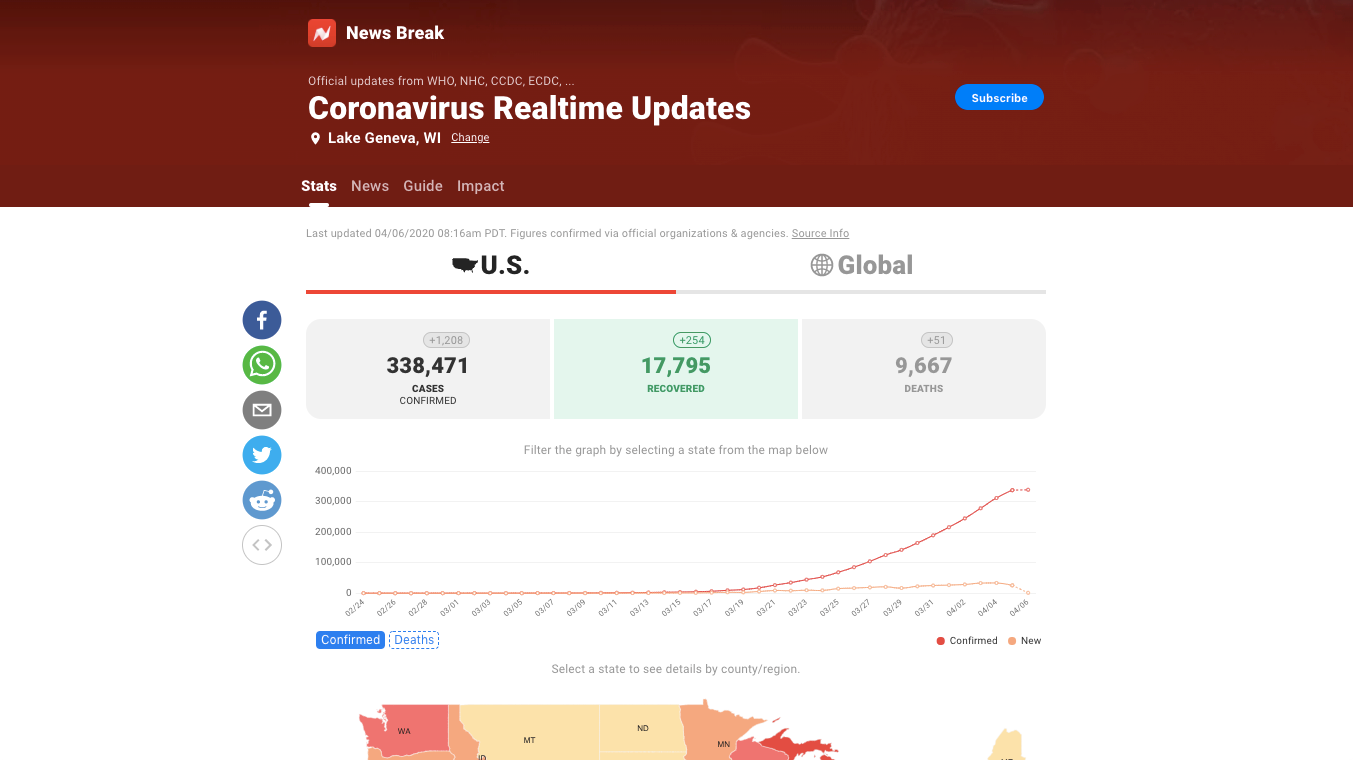
1. News Break: COVID-19 Realtime Updates
News Break provides a map in addition to a graph of new cases, total cases, and deaths. A detailed table below offers easy access to state- and county-level data and local news in your area.
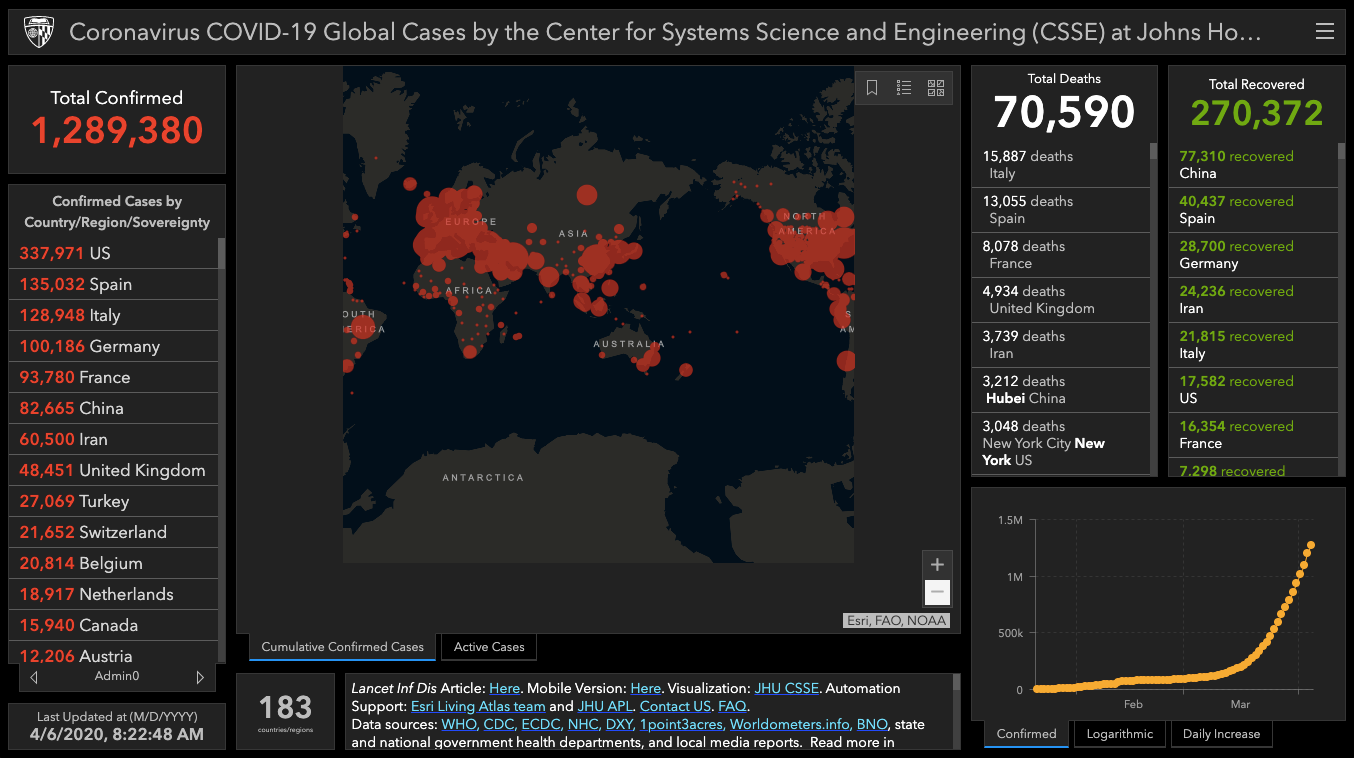
2. Johns Hopkins: Coronavirus COVID-19 Global Cases
Johns Hopkins’ public COVID-19 data dashboard is one of the most often quoted in the news. This comprehensive dashboard features a worldwide map of cases and additional widgets offer a number of breakdowns.
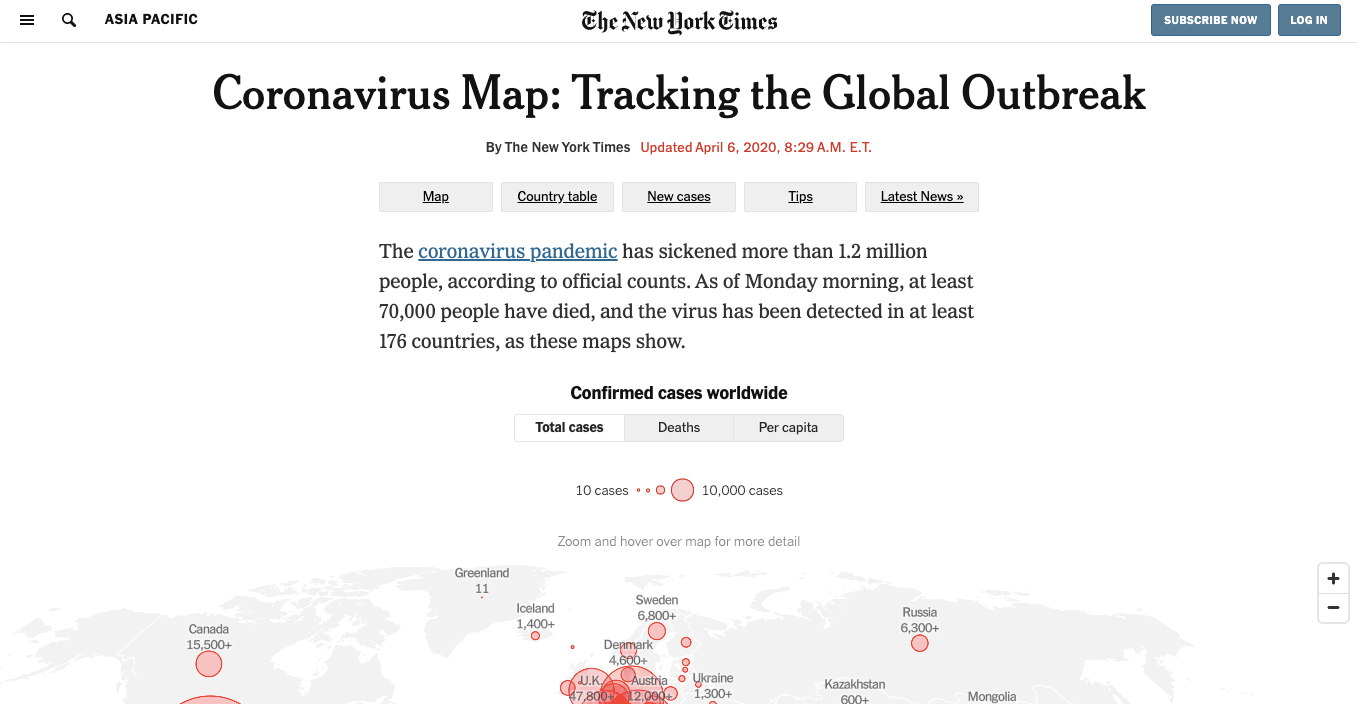
3. New York Times: Coronavirus Map: Tracking the Global Outbreak
This New York Times resource provides a clean and simple interface, including a world map and a visualization of increases by day, per country. (Requires free registration.)
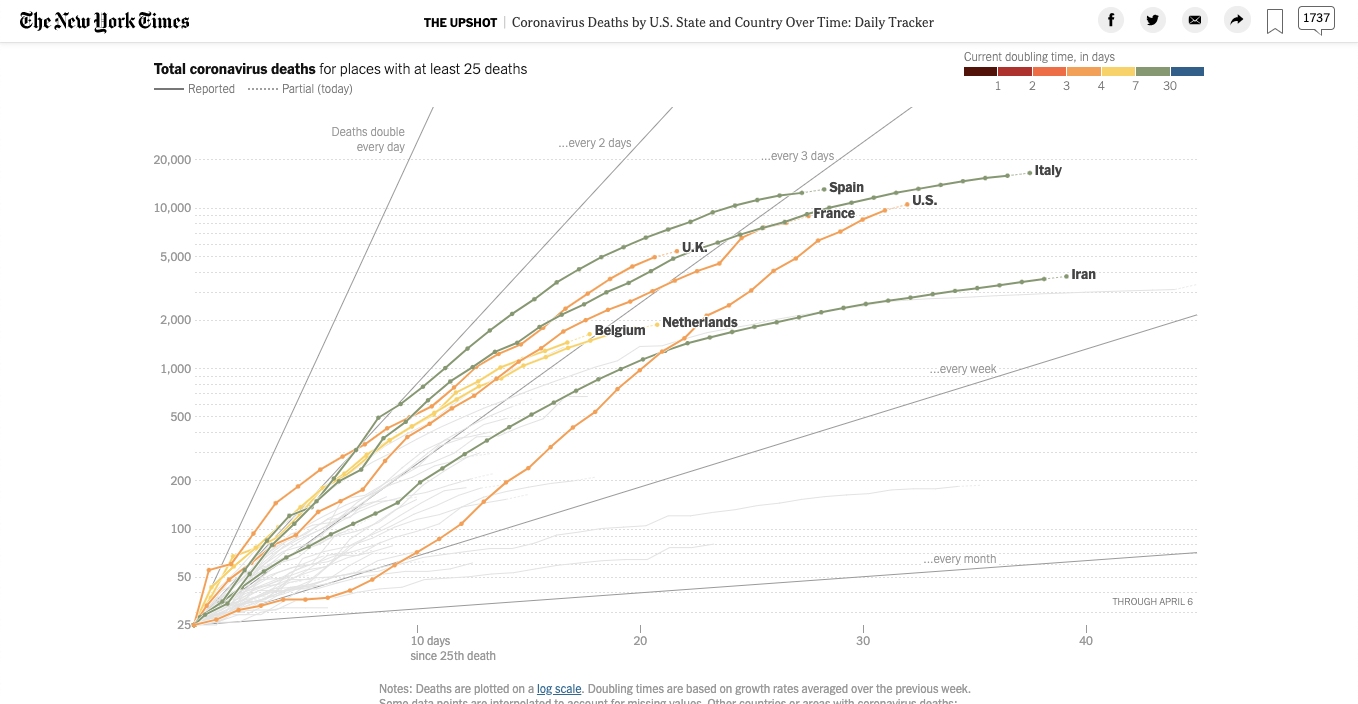
4. New York Times: Coronavirus Deaths by U.S. State and Country Over Time: Daily Tracker
This resource compares deaths by state and country over time. (Requires free registration.)
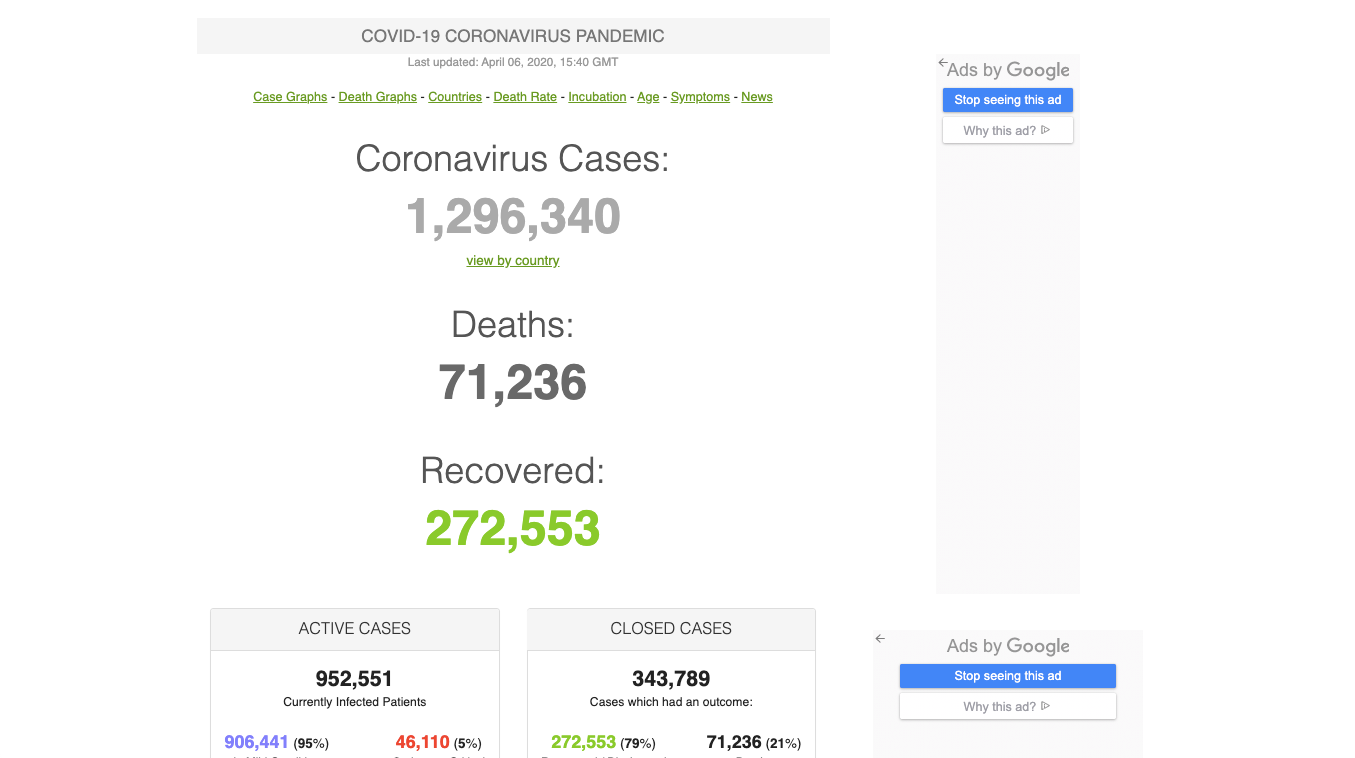
5. Worldometer: Coronavirus Stats and Graphs
Worldometer provides an extensive collection of stats and graphics, with multiple breakdowns of most data categories to help you dig deeper. There is a huge table that lists data per country. (Warning: Lots of ads on Worldometer’s pages.)
6. The COVID Tracking Project: Most Recent Data
The COVID Tracking Project focuses on U.S. data. Unlike other data sources, this project also includes data on the total number of tests completed. It also provides links for the best and most timely updates for each state.
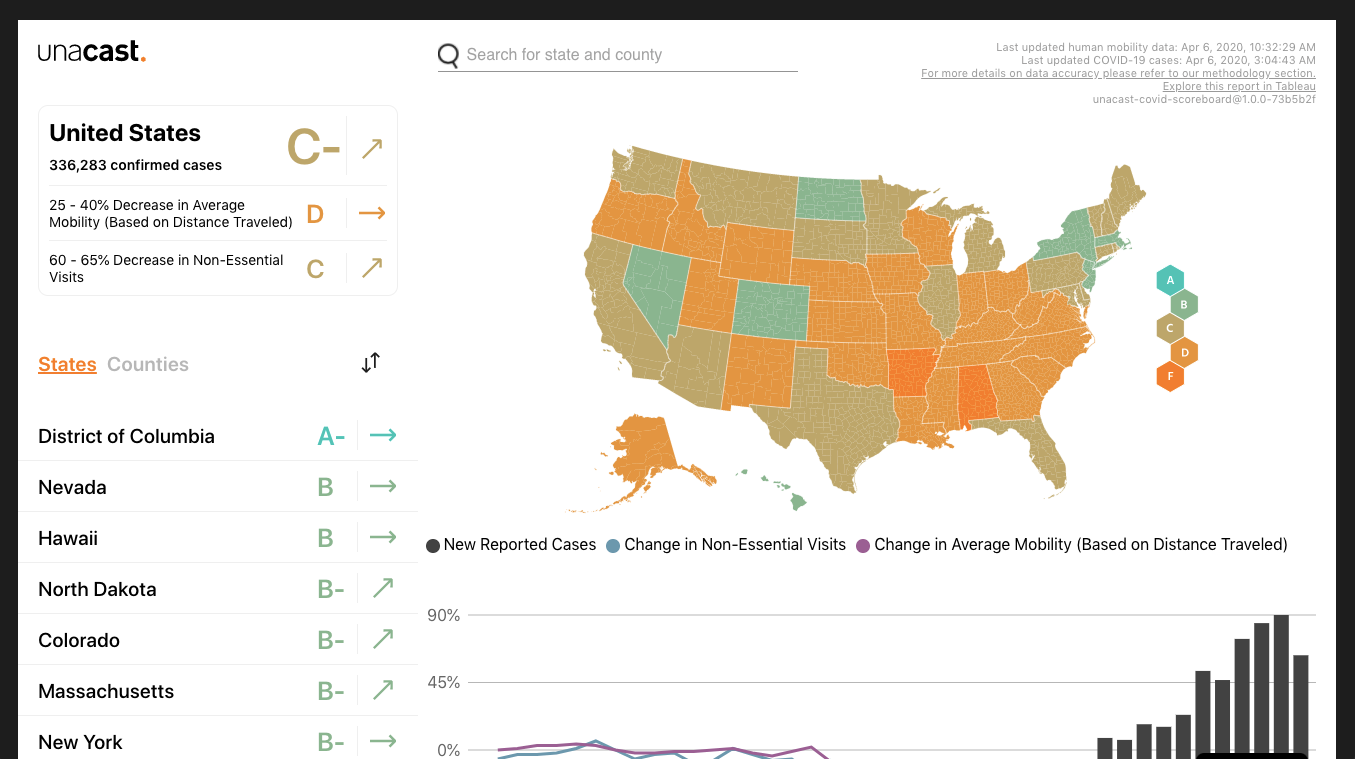
7. Unacast: Covid-19 Social Distancing Scoreboard
Unacast scores each U.S. state and county on how well people are following social distancing guidelines. Data on the number of non-essential visits and the average mobility based on distance traveled is also graphed.
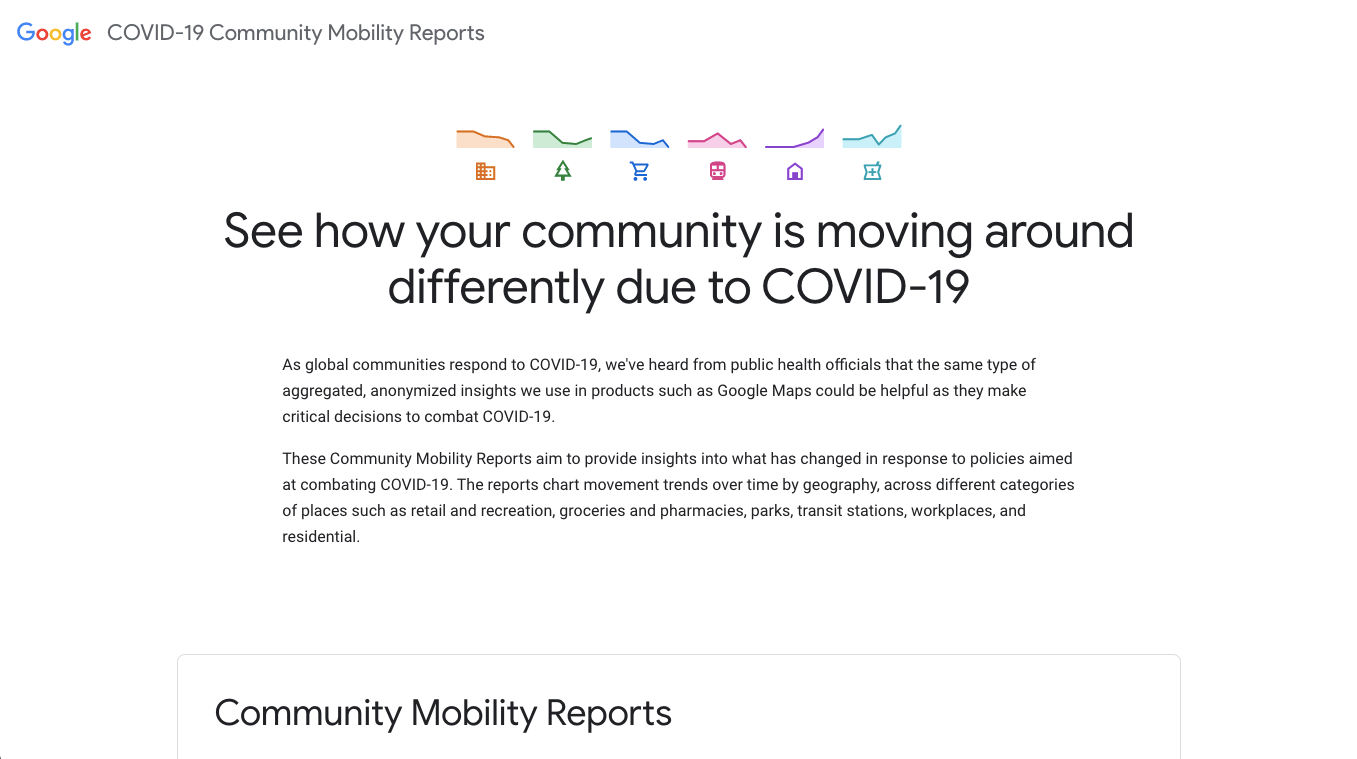
8. Google: COVID-19 Community Mobility Reports
Google shows off its data prowess with detailed Community Mobility Reports. Policy makers can use this data to understand a general population’s decreasing (or increasing) activity in and around six categories of locations: retail and recreation, grocery and pharmacy, parks, transit stations, workplaces, and residential.
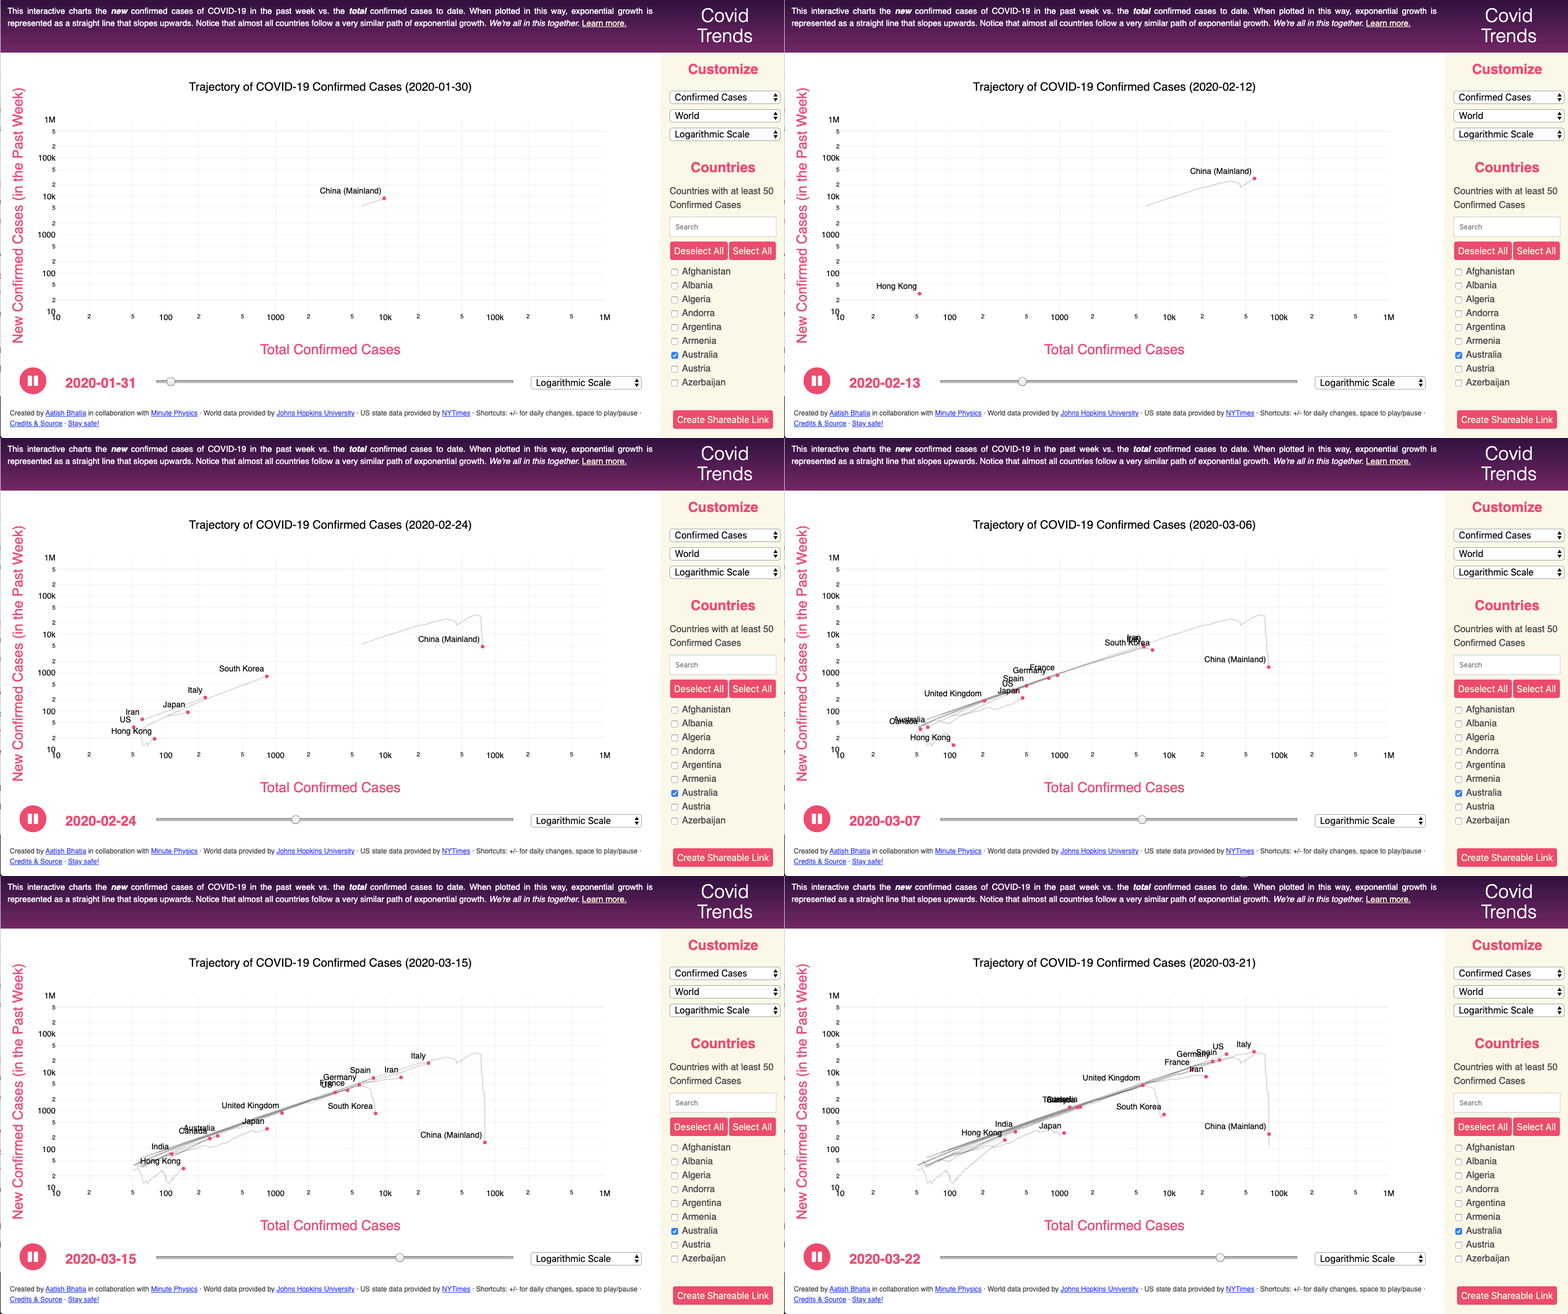
9. Aatish Bhatia: Trajectory of COVID-19 Confirmed Cases
In a brilliant animation, Aatish provides a look at data that attempts to answer the question, “Are we winning yet?” The video below provides a detailed explanation of this graph and animation.
Wash Your Hands, Hunker Down, and Stay Safe
It goes without saying that these are unprecedented times. I really do hope that you, your families, and your businesses are safe and healthy. Our thoughts and prayers go out to you, and to us all, in these difficult times.
What's Next?
Profound Strategy is on a mission to help growth-minded marketers turn SEO back into a source of predictable, reliable, scalable business results.
Start winning in organic search and turn SEO into your most efficient marketing channel. Subscribe to updates and join the 6,000+ marketing executives and founders that are changing the way they do SEO:
And dig deeper with some of our best content, such as The CMO’s Guide to Modern SEO, Technical SEO: A Decision Maker’s Guide, and A Modern Framework for SEO Work that Matters.
